
Renting a home comes with plenty of variables, but one factor can make or break the experience: the landlord. A good one communicates clearly, keeps up with repairs, and makes tenants feel at ease. A bad one can turn everyday living into a source of stress.
To better understand how renters across the country view their landlords, the team at Ovid surveyed more than 2,300 people from 48 states. Their responses allowed us to score each state, highlight where renters have the best and worst experiences, and uncover national insights into what Americans value most in a landlord.
Which States Have the Best Landlords?
Landlords have a major influence on how renters experience their homes. From timely repairs to open communication, the difference between a positive rental experience and a negative one often comes down to the person managing the property. Our survey results show clear divides across the country, with some states setting the bar for strong landlord-tenant relationships and others falling far behind.
States with the Best Landlords:
- Maryland (73.3 out of 100) – Renters here gave landlords the highest ratings overall, especially for being proactive with preventive maintenance.
- Hawaii (70.4) – Known for landlords who go “above and beyond” more often than any other state, though routine upkeep remains a weak spot.
- Maine (69.8) – A consistent performer across all factors, with renters reporting solid experiences even if the state didn’t lead in any single category.
- Idaho (69.8) – Scored highest for landlord communication, with very few renters saying they’ve ever filed a formal complaint.
- Illinois (68.9) – Renters highlighted quick response times, with many saying maintenance requests were resolved within three days.
These top states share common themes: strong communication, responsiveness, and a willingness to prevent problems before they escalate. Maryland stands out for its balance of high marks across the board, while Hawaii’s personal touch shows that tenant relationships matter, even in a market with steep housing costs. Maine, Idaho, and Illinois round out the list by proving that consistency and reliability can be just as valuable as standout performance in a single category.
States with the Worst Landlords:
- Arizona (14.1 out of 100) – Ranked last due to widespread rent hikes, with more than half of renters saying rising costs forced them to move.
- Washington (27.6) – Noted for sluggish response times, with the lowest rate of maintenance handled within three days.
- Georgia (32.7) – Renters there filed complaints at one of the highest rates in the country and frequently cited common rental issues.
- Arkansas (32.8) – Reported the lowest rate of security deposit returns, paired with slow maintenance response times.
- North Dakota (34.3) – Scored lowest for communication, with over half of renters saying they’d moved before due to landlord issues.
The bottom states tell a different story. Communication gaps, delayed repairs, and unexpected costs push tenants to leave at far higher rates. Arizona stands out for its rent hikes, while North Dakota shows how poor communication alone can drive renters away. These findings suggest that when landlords fail on the basics — affordability, communication, and fair treatment — it leaves a lasting impact on the rental experience.
Across the board, the contrast between the top and bottom states makes one thing clear: renters value landlords who communicate openly and act quickly. Next, we’ll step back from the state rankings to see what the national results reveal about how Americans feel about landlords as a whole.
What Renters Really Think About Their Landlords
While the state rankings highlight big regional differences, the national data shows how Americans feel about landlords more broadly. The survey uncovered a mix of frustrations and bright spots, painting a complex picture of the rental experience in the U.S.
How Renters Rate Their Landlords
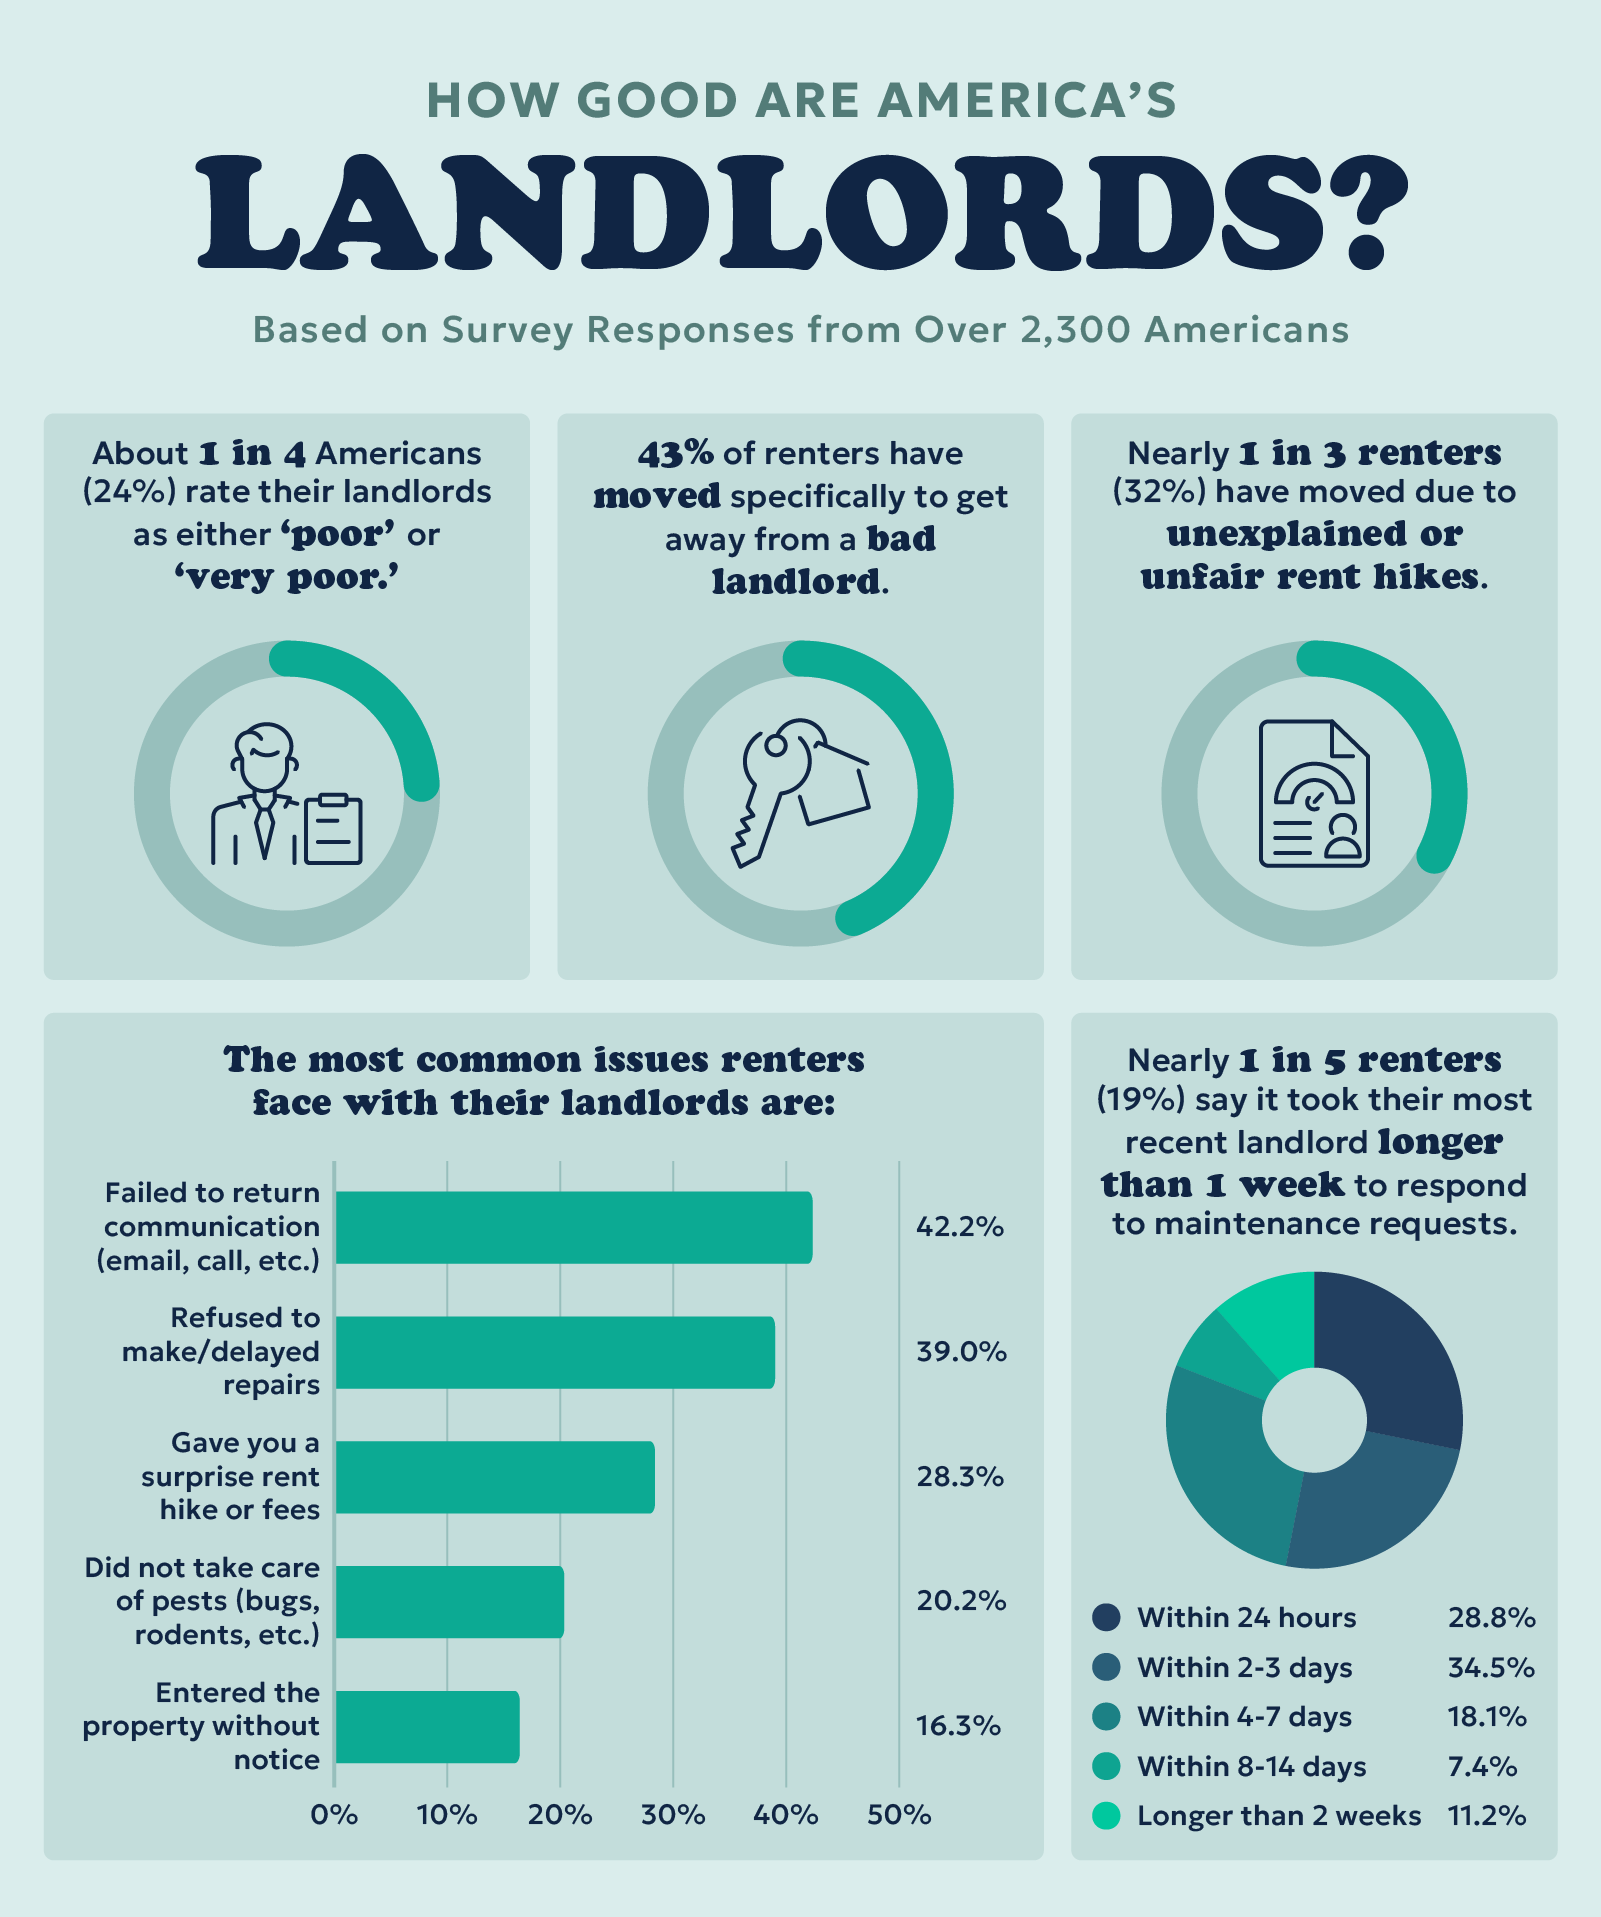
- About 1 in 4 renters (24%) rated their landlords as “poor” or “very poor.”
- Nearly half (49%) gave their landlords higher marks, saying they were “good” or “excellent.”
This divide shows how variable the landlord-tenant relationship can be. For some, renting comes with responsive care and fair treatment, while others find themselves dealing with neglect or frustration.
Individual Landlords vs. Property Management
- Renters with individual landlords were more than twice as likely to rate their experience as “excellent” (22%) compared to those renting through property management companies (9%).
- Individual landlords were also more likely to go above and beyond, with 45% of renters saying they’d helped them through a difficult situation, compared to 28% for property management.
These numbers suggest that smaller-scale landlords are often able to offer more personal support, while renters dealing with management companies may feel like just another tenant on the list.
Common Issues Renters Face
- 42% reported landlords failing to return communications.
- 39% cited delays or outright refusals to make repairs.
- 28% faced surprise rent hikes or fees.
- 20% dealt with landlords not addressing pest issues.
- Nearly 1 in 5 renters (19%) said it took more than a week for their most recent landlord to respond to maintenance requests.
These frustrations cut across age groups, but Gen Z renters felt them most acutely. Younger tenants were more likely to experience delayed or refused repairs (43%) and even retaliation for filing complaints (10%).
When Renters Decide to Move
- 43% said they’d moved specifically to get away from a bad landlord.
- Nearly 1 in 3 (32%) moved due to unexplained or unfair rent hikes.
These figures underscore just how disruptive landlord issues can be. For many renters, problems don’t just affect day-to-day life — they’re enough to drive people from their homes entirely.
When Things Go Right
Despite the frustrations, many renters also shared positive experiences. More than one-third (37%) said their landlord had gone above and beyond to help them in a difficult situation. These stories remind us that while negative experiences are common, good landlords can leave lasting impressions.
Overall, the national data reflects both sides of the rental experience: the challenges of poor communication, delayed repairs, and rising costs, alongside the value of landlords who are responsive and empathetic. It’s clear that while landlord quality varies widely, renters across the country know what they want most — communication, fairness, and reliability.
Closing Thoughts
Our survey showed just how different the renting experience can be depending on where you live. Some states set the standard for communication, fairness, and responsiveness, while others leave renters frustrated by slow repairs, sudden rent hikes, or poor treatment. Nationally, the divide is just as clear. About half of Americans report positive experiences with their landlords, but a significant share point to problems serious enough to push them out of their homes.
For many older Americans, renting often becomes part of life after downsizing. That makes the quality of landlords all the more important, since the right relationship can ease the transition and provide stability during a new stage of life.
At Ovid, we understand that later chapters also involve financial decisions. Just as the right landlord can help renters feel secure, the right financial decisions can help you feel confident about the future.
One of those financial decisions may be selling your unused life insurance policy to free up funds you can use to enjoy your golden years. Find out how it works and see if you qualify today.
Methodology
To determine the U.S. states with the best and worst landlords, we surveyed over 2,300 people from 48 states and asked them a series of 10 questions about their most recent rental experience with a landlord or property management company. The survey took place over the course of two weeks in August 2025.
We used the responses to the 10 questions as the basis for a “landlord score.” Answers were quantified and assigned values after the survey was complete. Answers indicating a better landlord experience resulted in a higher value.
The average value for each question was calculated for each state and scaled from 0 to 10, so the best state for a given question received a 10 and the worst received a 0. We equally weighted each question and totaled them to give us a “landlord score” for each of the 48 states in the study.